Abstract: In the CMOS image sensor, A/D plays the role of “supporting the start and the nextâ€, accepting the signal from the front end, converting it into digital output, and its performance index directly affects the advantages and disadvantages of the whole system. As ADC speed and accuracy improve, how to test its dynamic and static parameters efficiently and accurately is the focus of ADC test research. The parameters of the ADC and the principle and method of the test are described. The software and hardware test platform of the ADC is built based on Labview software and data acquisition card, and the high-precision ADC computer-aided test system with low cost and high reliability is realized.
This article refers to the address: http://
With the rapid development of CMOS technology, CMOS image sensors have been widely used in the field of image acquisition such as ultra-micro digital cameras, PC computer eyes, fingerprint recognition, and mobile phones due to their high integration, low power consumption and low cost.
The workflow of the CMOS image sensor can be simply expressed as follows: the external light signal is collected by the pixel array and converted into an analog signal, and then transmitted to the A/D converter through the readout circuit, and finally to the subsequent digital circuit for processing. It can be seen that the A/D converter plays the role of “supporting and starting†in the whole CMOS image sensor, and its performance index directly affects the advantages and disadvantages of the whole system, so that the performance test of the ADC becomes very important.
At present, there are some common ADC test methods in the industry, such as histogram method for static index test, fast Four-Frequency transform method for dynamic index test, and sine wave adaptation method for ENOB, but there is no single test method. Can effectively test all ADC parameters.
ADC testing needs to solve the problem of cost and efficiency. Therefore, it is necessary to select some key indicators and effective test methods according to the typical application environment of the ADC to develop a reasonable test plan. In this paper, ADC is mainly used for the digital output of CMOS image sensor. Combined with Labview software analysis program and test instrument, a set of ADC comprehensive performance test system is built.
1 ADC performance test system
1.1 ADC performance parameters
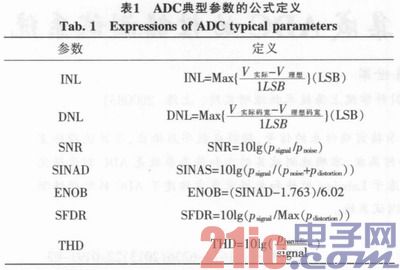
Parameters that characterize ADC performance can generally be divided into static parameters and dynamic parameters. Among them, the static parameters describe the inherent characteristics of the ADC itself, which are related to the error and noise of the designed ADC internal circuit. These errors include the gain error, offset error, integral nonlinearity (INL) and differential nonlinearity (DNL) of the ADC. Etc. The main concern is the relationship between the specific analog input level and the corresponding digital output code, characterizing the accuracy of the conversion of the stationary analog input signal into a digital output signal; while the dynamic parameters describe the ADC sampling and reproduction timing changes. The ability of the signal to focus on the performance of the ADC under AC conditions, including signal-to-noise ratio (SNR), spurious-free dynamic range (SFDR), total harmonic distortion (THD), SINAD, and valid bits. The number of (EN OB) and so on, these parameters are tested by inputting the appropriate sinusoidal analog signal and obtaining the digital code obtained by the correct conversion of the chip, and then performing the Fast Fourier Transform (FFT) calculation. Table 1 shows the formula definitions for typical ADC parameters.
1.2 Test principle and method
At present, conventional test systems cannot analyze multiple performance parameters at the same time. For example, a general dynamic test system can only test ADC dynamic parameters such as signal-to-noise ratio and signal-to-noise ratio, while a test system with transfer characteristics can only test transfer characteristics. Etc., has the disadvantages of poor adaptability and inconvenient use. In response to these shortcomings, this paper developed a comprehensive performance test system built by Labview software analysis program and test instrument. In this system, the test program combines the two test analysis methods, using the code density histogram test method to test the static characteristic parameters, and the FFT test method to test the dynamic characteristic parameters. In the test program, these test methods are only different in the mathematical analysis algorithm, and the hardware is basically the same. Therefore, it is convenient to select different test methods with one button according to different test conditions.
1.2.1 Code density histogram test method
The method uses the principle of statistics to perform the distribution of the amplitude domain of the output digital code in the case of inputting a sine wave. Figure 1 shows the bathtub curve generated by this method.
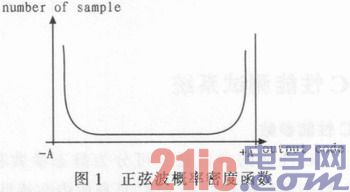
The horizontal axis of the bathtub curve represents 0 to 1,024 (210) digital code points, and the ordinate represents the number of outputs as the digital code. In the ideal case, the probability density function of the digital code distribution is:
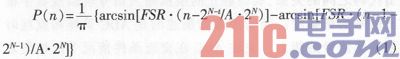
Where FSR represents the full-scale range of the ADC, n represents the serial number of the digital code, and N represents the resolution. In this ideal case, the difference between the number of digital codes that are actually measured and the number of digital codes that are actually measured can be obtained, and the error value of INL can be obtained by summing DNLk.
1.2.2 FFT analysis
The FFT method performs FFT operation on a set of data acquired in the time domain, obtains the Fourier spectrum of the sampled signal, and then obtains the power of the signal, noise and harmonic components from the spectrum, and obtains SNR, THD, SINAD, ENOB, and processing by calculation. These dynamic parameters of SFDR. In the actual test process, the relevant sampling principle needs to be applied, that is, the following formula must be satisfied:
In the formula, M is the number of sampling periods, must be an odd number, N is the total number of sampling points, and must be a power of 2 for the FFT algorithm. Ft is the input analog sine wave frequency, and fs is the sampling frequency. At the same time, in order to obtain the best test efficiency and reduce the test time, the M and IV requirements are irreducible, and in order to ensure a certain fault coverage of the FFT transform, the value of N cannot be too small.
1.3 Test system components
The 10bit, 8Msps ADCs measured in this paper are mainly used for chip-level digital output of CMOS image sensors. The structure is pipelined. The input signal swing is 2.4 V for Vp-p and the common mode voltage is 2.5 V, which means analog input voltage. The range is 1.3 to 3.7 V. The analog input accuracy is 1LSB=(Vinmax-Vinmin)/2n=2.34 mV (n is the number of digital output bits). In order to test such a precision chip, we need to input a higher precision analog voltage. Therefore, in addition to the high requirements for the selection of test methods, it also puts high requirements on the composition of the test system and the design and production of the test board.
Figure 2 shows the structure of the ADC test platform. The working principle of the system is: a sine wave generated by the sine wave generator slightly larger than the input range of the full-amplitude of the ADC is input as an analog signal to the ADC test board, filtered and input to the ADC input terminal, and the ADC converts it into corresponding The digital output is output to the digital acquisition card, and the acquisition card combines it into a digital code, and then analyzes it with analysis software to give the test result.
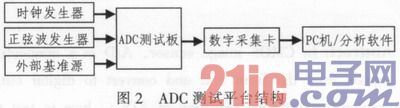
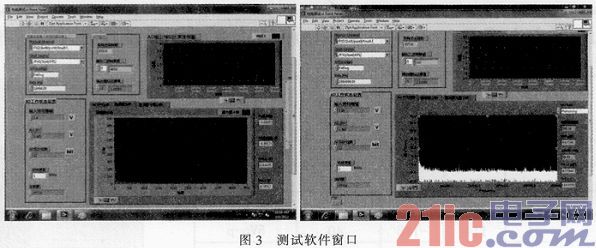
The system uses Labview's virtual instrument to realize data sampling control of the data acquisition card and analyze and process the collected data. In the program for controlling the digital acquisition card, it should be set to external clock sampling and limited sampling mode to achieve consistent sampling of the signal, and to ensure that the sampling of the acquisition card is synchronized with the ADC; when analyzing the collected data, consider The system needs to analyze and process two different test methods. Therefore, after converting the numbers collected by the digital capture card into the U16 standard number format, input it into a case structure program box, and select different test modes on the front panel. It is easy to meet the testing requirements of the test software for different characteristic parameters. Figure 3 shows the window of the code density test software on the left and the FFT test software window on the right. It contains control areas for the capture card and ADC, as well as output areas for output parameter display.
1.4 Test results
Using the above test system, the performance of the 8Msps 10-bit ADC in the CMOS image sensor was tested. The test results are shown in Table 2.
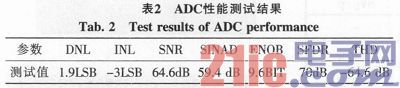
Test results show that this system can effectively measure the performance parameters of the ADC.
2 Conclusion
In this paper, a CMOS image sensor integrated pipeline ADC is used as a test example. LABview is used as a software to build a test system that can comprehensively test the static and dynamic performance of the ADC. The system has simple test procedure, comprehensive test parameters and low hardware cost. And so on, and through the test of the self-designed ADC, the results show that the system can accurately characterize the performance of the ADC.
UCOAX offer drone wire assembly solutions for many customers all over the world.
We have many solutions for machine vision data transmission and connection to solve the complex problem,worth of your contacting.
If you're interested in our drone link cable high speed low attenuation low noise with interface and length options, welcome to buy the quality products at competitive price with our factory. We also support customized production if you need. As one of the leading Custom Camera Link Cable manufacturers in China, we're waiting for your contact.
Drone Link Cable,D Line Cord Cover,D-Line Cable Cover,D Line Wire Cover
UCOAX , https://www.jsucoax.com